Table of Contents
Reports
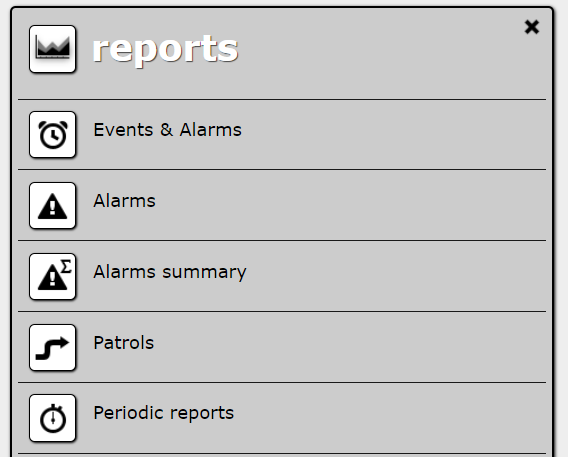
Historical information about alarms, patrols and other events is available in the form of reports. To open available reports list, choose Reports from the main menu.
There are the following report types:
- Events and Alarms,
- Alarms,
- Alarms summary,
- Patrols.
Each report type can be generated on demand on the screen, in a printable format or to a CSV file. Reports can also be generated automatically and sent by e-mail periodically.
Basic report features
Choosing a report from the reports panel opens a new panel with this report.
Every report panel contains filters (search criteria) and a table with report results.
To generate a report with data meeting the pre-set criteria, click the > button. To clear criteria, click the X button.
Reports displayed on screen or generated in a printable format have a 1,000 record limit. It means only the first 1,000 records meeting the criteria are shown. The limit does not apply to CSV files, which always contain full results.
Like other lists, report results can be sorted by every column. Clicking a column heading sorts table by that column or switches between ascending and descending sort order.
To generate the report in a printable format or in a CSV file (i.e. export the report), choose the relevant option in the tools menu under the cog icon (in the upper right corner). There are two export options:
- Print: contains the same data as the list on the screen, only the style is adjusted to printing.
- Export to CSV: the generated CSV file includes all visible columns and id columns for entities such as companies, sites, routes, etc. and is not limited to 1,000 records.
Events and alarms report
This report contains all significant events which had happened in the system. They can be divided into the following categories:
- Informational events:
- events received from ActiveGuards, ActiveTracks and other connected devices (excluding TEST and LOCATION events);
- patrol events such as PATROL_FINISHED, TAG_COMPLETED;
- workplace entry and exit events.
- Alarm events:
- alarms such as PANIC, received from ActiveGuards, ActiveTracks and other connected devices;
- Patrol failed alarm, generated by ActiveView based on user-defined routes;
- alarms caused by reading an alarm TAG.
- Events from the AT Mobile application:
- Apart from having functionalities in close solutions such as Active Track or Active Guard, the AT Mobile application enables sending a report containing a photograph and a comment. The last column in the NEW_PHOTO item contains the comment text attached to the report, while the item CONTENT_READY contains the photograph. To display them, double-click left mouse button on the event or right-click and select Show photo. A photograph from the AT Mobile application will be displayed on the right.
The events and alarms report has the following columns:
- Detected – date and time when the event/alarm was received/detected by the system.
- Occurrence – date and time of the event/alarm occurrence.
- Type – type of the event/alarm.
- Device, Device s/n – device name and serial number. NOTE: Empty for patrol events/alarms which are not associated with any particular device (all but TAG_COMPLETED).
- Company – company name. NOTE: Empty if the event/alarm comes from a device not associated with any company.
- Site – site name. NOTE: Empty if the event/alarm comes from a device not associated with any site.
- Route – route name. NOTE: Filled only for events/alarms associated with patrols.
- Tag - tag name. NOTE: Filled in only for patrol events/alarms
- Guard name – guard name. NOTE: Filled only for events/alarms generated by a TAG read with a device linked to a guard.
- Employee name – employee name. NOTE: Filled only for workplace entry and exit events.
- Alarm Group – if the event is connected to a site (e.g. comes from a device linked to a site) and there was an alarm on the site, when the event was detected, Alarm group is the ID of that alarm.
- Comment – a comment to an alarm. NOTE: Filled only for COMMENT_ADDED events.
When a filter is defined (i.e. a search criterion for a column is set), records with a corresponding column empty will not be returned.
ActiveTrack devices add position information to some of the events they send. This information is available in the CSV format of the Events and alarms report. There is also an additional option in the tools menu (under the cog icon), to show the currently listed events on a map. It opens a new browser window with the trace of the device marked. All events form a single trace, so you should use the Device filter in order to get meaningful results.
NOTE: Devices connected to ActiveView regularly send technical events, such as TEST. The events are not listed in the Events and alarms report by default. In the case of ActiveTrack devices, these events can contain position information. In particular, there is the LOCATION technical event, which only purpose is to inform ActiveView about the device’s position. If you want these events in the Events and alarms report (i.e. to be able to see them on a map), ask your ActiveView administrator.
Alarms report
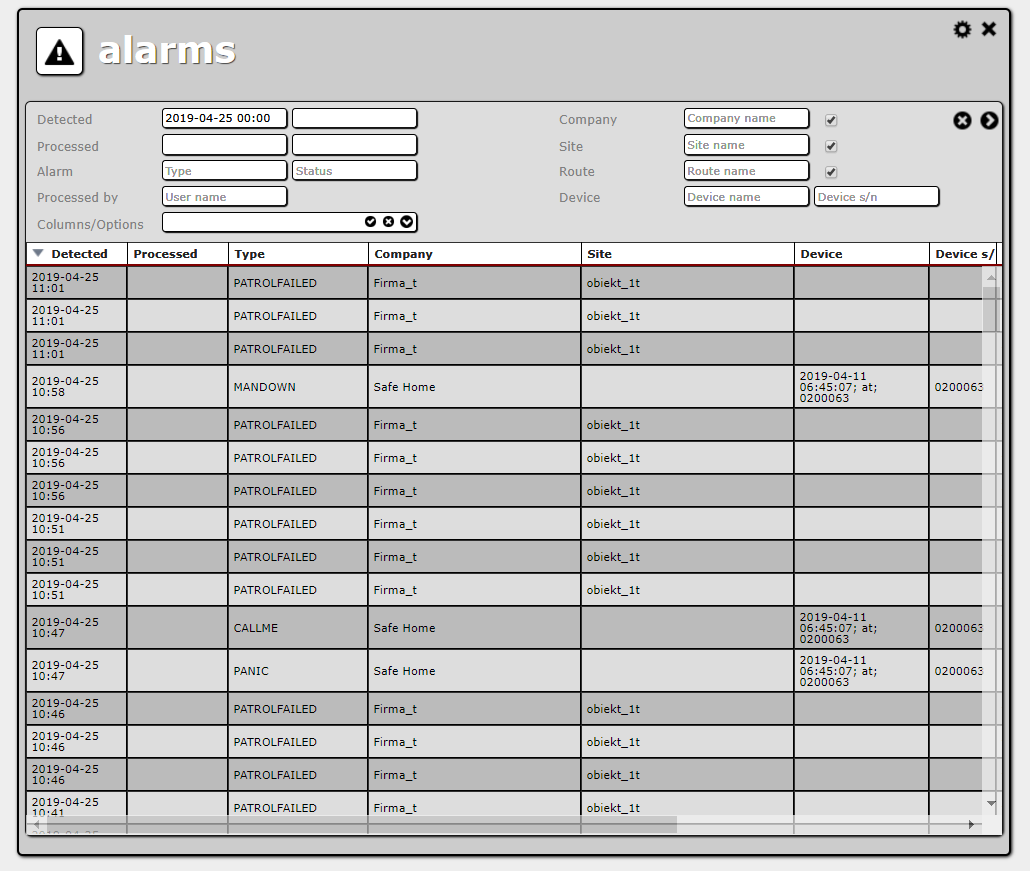
This report aggregates basic information about alarms.
The alarms report has the following columns:
- Detected – date and time when the alarm was detected by the system.
- Processed – date and time when the alarm was processed. NOTE: Empty if it has not been processed yet.
- Type – type of the alarm.
- Company – company name. NOTE: Empty if the alarm comes from a device not associated with a company.
- Site – site name. NOTE: Empty if the alarm comes from a device not associated with a site.
- Device, Device s/n – device name and serial number. NOTE: Empty for Patrol failed alarms, because they are not associated with any particular device.
- Route – route name. NOTE: Filled only for alarms associated with patrols.
- Status – alarm status (state).
- Processed by – name of the ActiveView user who processed the alarm. NOTE: Empty if it has not been processed yet.
ActiveTrack devices can be configured to add position information to alarm events. This information is available in the CSV format of the Alarms report. There is also an additional option in the tools menu (under the cog icon), to show the currently listed alarms on a map. It opens a new browser window with the trace of the device marked. All alarms form a single trace, so you should use the Device filter in order to get meaningful results.
NOTE: This report does not group alarms by site, like the alarms list and alarms browser. Even if two or more alarms from a single site were detected in succession, they are listed separately.
Alarms summary report
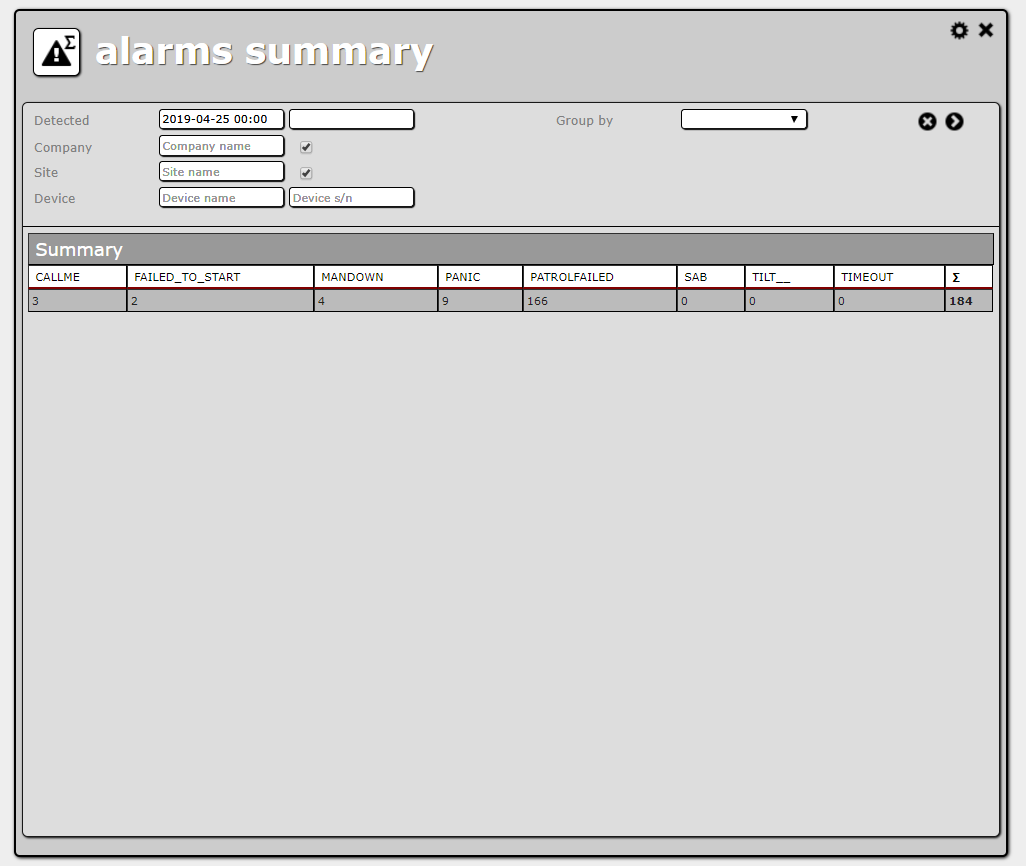
This report is based on the same data as the Alarms report, but the data are aggregated. The report contains totals for every alarm type, for every company, site or device (depending on user choice).
In the Alarms summary report, columns correspond to different types of alarms. Rows correspond to companies, sites or devices, depending on the grouping chosen by the user in report parameters. There is also a final row with totals for every alarm type (summary).
The alarms included in sums can by filtered by the following criteria:
- Detected – date and time when the alarm was detected by the system.
- Company – company name. NOTE: Setting this filter will exclude all alarms not associated with a particular company (see Alarms report description for details).
- Site – site name. NOTE: Setting this filter will exclude all alarms not associated with a particular site (see Alarms report description for details).
- Device – device name or device serial number. NOTE: Setting this filter will exclude all alarms not associated with a particular device (see Alarms report description for details).
- Group by - possibility of grouping by company, site or device.
Patrols report
This report shows information about finished patrols (either successful or not).
The Patrols report has the following columns:
- Patrol start – patrol start date and time.
- Company – the name of the company which the site where the patrol was conducted belongs to.
- Site – the name of the site where the patrol was conducted.
- Route – the name of the route which defined the patrol.
- Checkpoints [+] – the number of successful checkpoints (i.e. checkpoints passed on time).
- Checkpoints [-] – the number of unsuccessful checkpoints (i.e. checkpoints not passed on time).
Unsuccessful patrols are highlighted in red (i.e. the patrols with at least one unsuccessful checkpoint).
Periodic reports
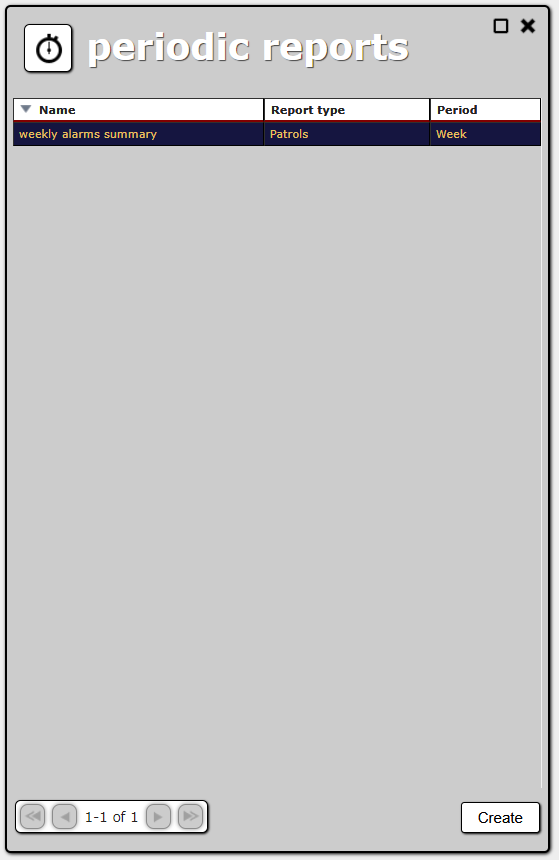
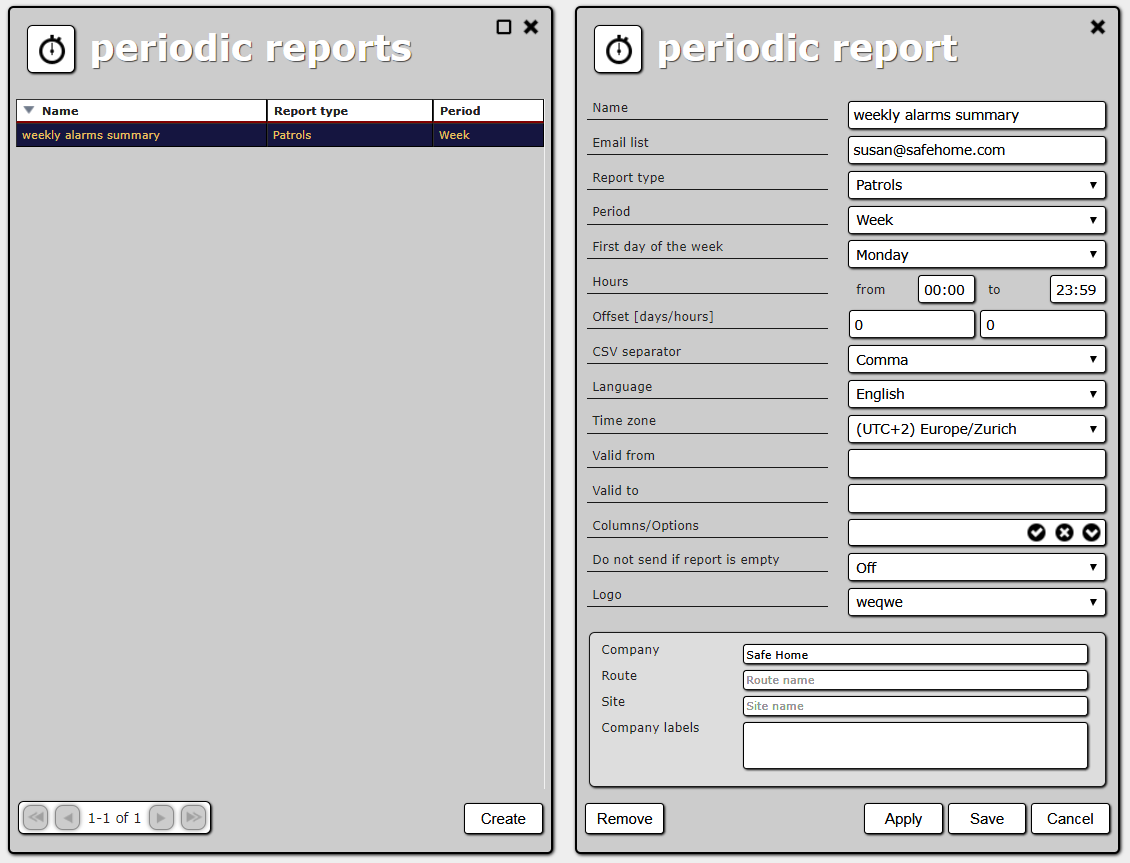
Each report can be configured to be sent by e-mail. To open periodic reports list, select Reports → Periodic Reports in the main menu.
You can create a new periodic report and edit or remove an existing one.
Every periodic report has the following properties:
- Name – unique periodic report name. It allows you to find the report on the periodic reports list.
- E-mail list – recipients’ e-mail addresses, separated by commas.
- Report type – type of report to be generated.
- Period – time periods the report will cover. Choosing for example “Month” will result in a report generated every month, covering the previous month.
- First day of the week [weekly reports only] - reports will cover 7 days from the first day of the week. Choosing for example “Wednesday” will result in a report generated every Thursday, covering last Thursday, last Friday, Saturday and so on until Wednesday (i.e. the previous day).
- Period first day [monthly, quarterly and yearly reports only] - reports will cover a month, a quarter or an year from the “period first day” of every month/quarter/year (see examples below).
- Hours - the hours reports will cover every day (see examples below). Default values “from 00:00” and “to 23:59” mean that reports will cover whole days.
- Offset [days/hours] – offset in days and hours from the end of the chosen period when reports will be generated. For example: for a period of a week and offset 3 days and 8 hours, reports will be generated every Thursday, at 8 a.m., and will cover time span from previous Monday to last Sunday.
- CSV separator – a character used to separate columns in generated CSV files. The default is the separator character set in user settings.
- Language - language in which reports will be generated.
- Time zone – time zone in which periods will be calculated and times and dates in reports will be displayed. The default is the time zone set in user settings.
- Valid from - reports will start to be generated after this date and time (see examples below).
- Valid to - reports will not be generated after this date and time (see examples below).
- Columns – set of columns which will be included in report (default all columns).
- Filters – all filters applicable to the chosen report type, except filters by date and time (data for periodic reports are filtered by date based on the selected periodicity).
E-mails with periodic reports contain report results in a printable format and in a CSV file (attached). For periodic reports to work, a correct e-mail configuration is needed (see E-mail configuration for details).
<WRAP tip> Example 1
You want a daily report, covering time span from 9 a.m. (inclusive) to 5 p.m. (exclusive), generated after 3 a.m.:
- Period: Day
- Hours: from 9:00 to 16:59
- Offset: 0 days and 10 hours
- Valid from: empty (default)
- Valid to: empty (default)
</WRAP>
<WRAP tip> Example 2
You want a weekly report, covering time span from Thursday to Wednesday every week and from 8 p.m. (inclusive) to 8 a.m. (exclusive) every day, generated every Friday, at 10 a.m.. You also want this report to be generated only from 1 July 2014 to 31 December 2014:
- Period: Week
- First day of the week: Thursday
- Hours: from 20:00 to 7:59
- Offset: 1 day 2 hours
- Valid from: 1/07/2014
- Valid to: 31/12/2014
With this definition, you will get the following reports:
- The first one will be generated on on 1 July, at 10 a.m. It will cover time span from 8 p.m. 19/06/2014 to 8 a.m. 20/06/2014, from 8 p.m. 20/06/2014 to 8 a.m. 21/06/2014 etc., the last time span will be from 8 p.m. 25/06/2014 to 8 a.m. 26/06/2014
- The second report will be generated on 4 July, at 10 a.m. It will cover time span from 8 p.m. 26/06/2014 to 8 a.m. 27/06/2014, from 8 p.m. 27/06/2014 to 8 a.m. 28/06/2014 etc., the last time span will be from 8 p.m. 2/07/2014 to 8 a.m. 3/07/2014
- The same goes for subsequent reports.
- The last report will be generated on 26 December, at 10 a.m.
</WRAP>
<WRAP tip> Example 3
You want a quarterly report, but with quarters starting on 9 February, 10 May, 9 August and 9 November (in the 40th day of each quarter):
- Period: Quarter
- Period first day: 40
- Hours: from 00:00 to 23:59 (defaults)
- Offset: 0 days and 0 hours (defaults)
- Valid from: empty (default)
- Valid to: empty (default)
With this definition the first report generation date depends on when you create the definition. For example:
- If the definition is created on 10 January, then:
- the first report will be generated on 9 February (around midnight). It will cover time span from 9 Decemeber in the previous year to 8 February in the current year;
- the second report will be generated on 10 May (around midnight). It will cover time span from 9 February to 9 May;
- … and so on.
- If the definition is created on 1 April, then:
- the first report will be generated on 10 May (around midnight). It will cover time span from 9 February to 9 May;
- the second report will be generated on 9 August (around midnight). It will cover time span from 10 May to 8 August;
- … and so on.
</WRAP>
